Bell Eapen MD, PhD.

Bringing Digital health & Gen AI research to life!

How to visualize PKPD models

PKPD Visualization

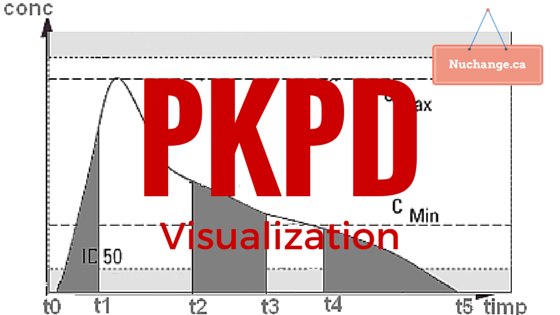
Image credit: Farmacist at ro.wikipedia [Public domain], from Wikimedia Commons. (Image altered and text added)

A couple of my friends asked me about ideas for PKPD visualization for their projects. I am not a PKPD expert, but I have tried to organize some of the tools for this purpose that I have found during my search. Maybe it will help someone to avoid reinventing the wheel.

First a brief introduction to the problem as I understand:

Pharmacokinetics (PK) is what the body does to the drug (elimination or redistribution). Pharmacodynamics (PD) is what the drug does to the body (Its effect). PKPD models conceptually link both into a composite time-effect graph. Calculations associated with this conceptual linking can be quite complicated, but computers simplify this considerably.

Now a brief consideration of the variables in this calculation, again as I understand.

The calculation depends on elimination process, number of compartments, route and the regimen of drug administration.

You need clearance rate (CL), the volume of compartments V1…V3 and the intercompartmental clearance (Q1 & Q2).

A PKPD model can be described as systems of ordinary differential equations in PharmML for the number of compartments and the route of administration.

Now to the emerging concept of population pharmacokinetics:

In the above model, individual variations are not taken into account. You can calculate between-subject variability matrix if you have enough data available from various sources.

Now to the visualization options:

Visualization is important for patients to understand the need for dosage requirements in life threatening conditions like haemophilia and for doctors to plan appropriate dosage regimens.

PKPDSim by Ron Keizer (UCSF) – This is an R library that also provides a model exploration tool that dynamically generates a Shiny app from the specified model and parameters. ODEs for One, two and three model for various routes of administration is available in the library. Custom ODEs and between-subject variability can be defined. Shiny allows interactive exploration of the model, and it also generates the R code for any plot created in the interface. Shiny is R’s web application framework that turns your analyses into interactive web applications.

The example code to run shiny after installing all dependencies is below:

install.packages("devtools", dependencies = TRUE)
install.packages("ggplot2")
install.packages("shiny")
library(devtools)
install_github("ronkeizer/PKPDsim")
library(PKPDsim)

p <- list(CL = 38.48,
          V  = 7.4,
          Q2 = 7.844,
          V2 = 5.19,
          Q3 = 9.324,
          V3 = 111)

omega <- c(0.3,       # IIV CL
           0.1, 0.3)  # IIV V

sim_ode_shiny(ode = "pk_3cmt_iv",
              par = p,
              omega = omega)


Simulx: (A R function of the mlxR package for computing predictions and sampling longitudinal data from Mlxtran and PharmML models.). Details are available on their website: Here is a PKPD example for warfarin. Simulx also supports interactive visualization through Shiny

Plotly is an innovative Canadian startup founded by Alex Johnson, Chris Parmer, Jack Parmer, and Matt Sundquist headquartered in Montreal, Quebec. Plotly is an online analytics and data visualization tool that has a variety of tools such as API libraries for various programming languages, and a javascript library. Plotly may be the ideal tool for fast visualization of PKPD data.

To sum up:

R libraries and hosted shiny applications may be ideal for physician level PKPD interface. plotly may be ideal for prototyping patient education tools that can be later converted into a web application using the various APIs.

P.S. Shiny example for PKPDsim is not functional at the time of writing. Ron has promised to fix it soon.

AngularJS and Electronic Health Records

I am not an Angular expert (as yet) though I used it for one of my successful applications called LesionMapper™. For the uninitiated, AngularJS is (yet another) javascript framework that is different in many ways. It extends HTML and implements the exciting concept of two-way data binding for dynamic web apps. If you are still skeptical about whether angular is big, please take a note of their logo that has a small (in)significant subscript: ‘by Google’. My intention here is not to dissect AngularJS and compare its many features or to disambiguate the diverse terminologies such as ‘directives’ and ‘expressions’ that makes it seem more daunting than it actually is.

Photocredit AngularJS @ github and jfcherry @ flikr (Images altered)

For health professionals, the bottom line is that AngularJS makes browsers powerful and can perform some of the tasks that are traditionally relegated to the server. So how is it going to improve our EMRs? During my student days, I have seen a popular regional EMR with a dismal user-interface. I have also seen a health analytics platform with more than 100 dropdowns on a single page. I have seen doctors returning to paper after failed EMR experiments. I have seen regional clinical viewers reeling under usability concerns. Can angularJS make any difference?

when I see a company mentioning they use angular, I read it as: no tech insight, no vision, hates life. #AngularJS
— Fredrik Carlsson (@fizk) November 15, 2014

A tool cannot change everything. Angular as a tool is not going to be a panacea. But the concept may change the way we think and organize our electronic health record systems. The traditional way of seeing EMRs as data-centric models was rejected by us, health professionals. Blame it on technology averse senior doctors or blame it on the inefficient healthcare system not learning from banks and airline industry, the fact is, eHealth failed to deliver! Will a new version with an improved interface change this? Unlikely!

EHealth has to accommodate our workflow, not the other way round. Because EMR is the tool, not us, physicians!

I know this is not my idea, and we have discussed this here before. How can AngularJS change this?

AngularJS could effectively separate presentation from storage. Our data scientists could work on the data layer (let me call it enterprise EHR) and concentrate on interoperability and population health. Our interface experts could work on the presentation layer customizing it for each department and each doctor, accommodating their workflow. (Let me call it Bring Your Own EMR #BYOE). We need a glue to bring both sides together. My vote is  for JSON/REST in the short term and RDF in the long term.

I am a huge fan of reverse innovation, and I am excited to see initiatives such as http://www.bahmni.org/ building AngularJS based customization layer on top of OpenMRS.org. True open source projects such as OpenMRS foster innovation (reverse or not).. It should open the eyes of others calling themselves open-source without being truly open! (Well.. that is another story..)

Related articles

Importing ONTODerm Ontology

Map of Colombia with Departments
Map of Colombia with Departments (Photo credit: Wikipedia)

Two engineering students from Colombia are using ONTODerm for a noble cause. They are planning to take dermatology to the poor and the underprivileged. They started a teledermatology project, but discontinued it because of lack of support. Now they are working on an Ontology based diagnostic application using semantic web technologies.

One of the problems they have encountered may be important to be addressed here. They could not import ONTODerm into Sesame. The URL provided in the ONTODerm home page is protege specific. However you can export the latest ONTODerm version in the native format from the project page on knoodl. Just request for a free membership to ONTODerm community.

Please keep me posted if you are using ONTODerm or DermKnowledgeBASE for any such projects and I wish both of them all the very best.

Running Tomcat as www-data

For last couple of days I have been working on a web based application for skin color measurement as I blogged here. The core of the application is implemented in php as it is much easier to handle. (May be I am more comfortable with it). But the GD image library for php has limited functionality. So I had to rely on Java for border detection and segmentation. So I implemented part of the functionality as a servlet running on tomcat6.

Today's latte, Apache Tomcat.
Today’s latte, Apache Tomcat. (Photo credit: yukop)

Both php and servlet had to read and write same files. But standard configuration does not allow this as php creates files as www-data (apache user) and tomcat creates files as tomcat6 user. I searched the internet for solutions. One suggestion was to create an appropriate umask for both which I could never completely understand. Finally I realised that the easiest solution is to make tomcat run as user www-data so that all created files will have same ownership.

I found this webpage with detailed instructions on how to do this. I would like to add two more steps:
1. Edit /etc/init.d/tomcat6 also to add the user ID and group ID
2. chown var/cache/tomcat6 directory also.

Nina Jablonski - The Evolution of Human Skin Color
Nina Jablonski – The Evolution of Human Skin Color (Photo credit: wagnerfreeinstitute)

BTW the application is hosted on my laptop. If you want to check it out click on the banner below if you see it. You will see it only when my laptop is on.